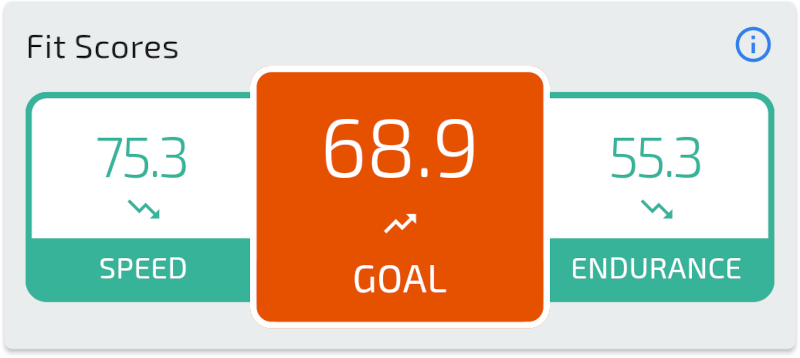
TrainAsONE Fit Scores are a unique set of metrics to measure your running fitness from your day to day running, and even your rest days.
Commonly, when people talk about their running fitness they break it down into two components: Speed and Endurance. Often saying such things as “I’ve lost some speed, but my endurance has remained’ or “I’ve lost some fitness, but could still run a sub 45 minute 10km”. However, apart from venturing out and running a set of time trials there has been no real way to make any form of objective measure. This is where the Fit Scores come in.
Using our advanced Artificial Intelligence (AI) and Machine Learning (ML), TrainAsONE calculates 3 numbers that represent your level of running fitness on a daily basis:
- Speed Score: Your capability for top speed running;
- Endurance Score: Your capability for running for a long time;
- Goal Score: Your fitness in respect of your personal goal, e.g. an upcoming 10 km race.
Each score is between 0 and 100, with 100 being world record performing.
The Fit Scores are a unique and very useful indicator of your running fitness as they objectively calculate three performance related markers that are colloquially used and understood. And importantly without having to perform any specific workout or laboratory assessment – in fact they can even be calculated on rest days with no activity or health data!
Not unexpectedly, with large periods of no data (and no running!) Fit Scores will become less and less accurate, with ever greater swings in value from day to day. Fortunately it will not take long for ‘normality’ to resume once a return to running takes place – and as always, the better the consistency of your running, the quicker this will take place.
As the above image illustrates, the TrainAsONE mobile app displays each of your current Fit Scores on the Home screen, along with a graphic below to indicate their current trend. An interesting point in the above example is that it is possible for your Speed and Endurance Scores to be trending down, yet your Goal Score be trending up. Furthermore, depending on certain factors, including the stage of your training, your Goal Score may trend downwards. Look out for some specific FAQs and articles to help answer when and why this may occur.
Additionally, whilst all the scores are in the range from 0 to 100, the spread varies. In other words the average score for Speed across the population is quite different for Endurance. This is a potential area of work for the future.
In due course we will elaborate a little on how the scores are derived. However, a very important point to raise now is that the underlying techniques being used can also be turned to race time prediction. We’ve already done this, with great success – our own comparison with other published work demonstrates superior accuracy. This, and other factors, give us great confidence and excitement about our Fit Scores. We still feel that we’ve only scratched the surface, and have many avenues to research that will make them and other features in mind even greater and provide an unrivalled training experience.


Comments are closed.