General
Performance
Performance (13)
Acute Training Load (ATL) summarises the immediate, short-term stress / strain placed on the body as a result of training or physical activity. Commonly representing 1 to 7 days, it is usually calculated from one or more metrics, for example duration, distance, heart rate, power output, or a combination of these factors. Commonly it is limited to objective measures, but subjective factors such as Rating of Perceived Effort can be incorporated.
The purpose of monitoring acute training load is to evaluate the immediate impact of training on the body and to help coaches and athletes make informed decisions about training progression, recovery, and risk of injury.
Further Reading:
Chronic Training Load (CTL) summarises the cumulative stress / strain placed on the body as a result of training or physical activity. Commonly representing 4 to 8 weeks, it is usually calculated from one or more metrics, for example duration, distance, heart rate, power output, or a combination of these factors. Commonly it is limited to objective measures, but subjective factors such as Rating of Perceived Effort can be incorporated.
The purpose of monitoring acute training load is to evaluate the immediate impact of training on the body and to help coaches and athletes make informed decisions about training progression, recovery, and risk of injury.
Further Reading:
One of the 3 Fit Scores to assess and monitor your performance with regards to your top-speed running.
When training for races of around 3 km or more, this metric will have more relevance than your Speed Score and resemble or at least trend similar to your Goal Score, especially with increases distance. Once your race distance approaches or exceeds a marathon, then will usually become quite similar.
TrainAsONE Fit Scores are a unique set of metrics to measure your running fitness from your day to day running, and even your rest days.
Commonly, when people talk about their running fitness they break it down into two components: Speed and Endurance. Often saying such things as “I’ve lost some speed, but my endurance has remained’ or “I’ve lost some fitness, but could still run a sub 45 minute 10km”. However, apart from venturing out and running a set of time trials there has been no real way to make any form of objective measure. This is where the Fit Scores come in.
Using our advanced Artificial Intelligence (AI) and Machine Learning (ML), TrainAsONE calculates 3 numbers that represent your level of running fitness on a daily basis:
- Speed Score: Your capability for top speed running;
- Endurance Score: Your capability for running for a long time;
- Goal Score: Your fitness in respect of your personal goal, e.g. an upcoming 10 km race.
Each score is between 0 and 100, with 100 being world record performing.
The Fit Scores are a unique and very useful indicator of your running fitness as they objectively calculate three performance related markers that are colloquially used and understood. And importantly without having to perform any specific workout or laboratory assessment – in fact they can even be calculated on rest days with no activity or health data!
Not unexpectedly, with large periods of no data (and no running!) Fit Scores will become less and less accurate, with ever greater swings in value from day to day. Fortunately it will not take long for ‘normality’ to resume once a return to running takes place – and as always, the better the consistency of your running, the quicker this will take place.
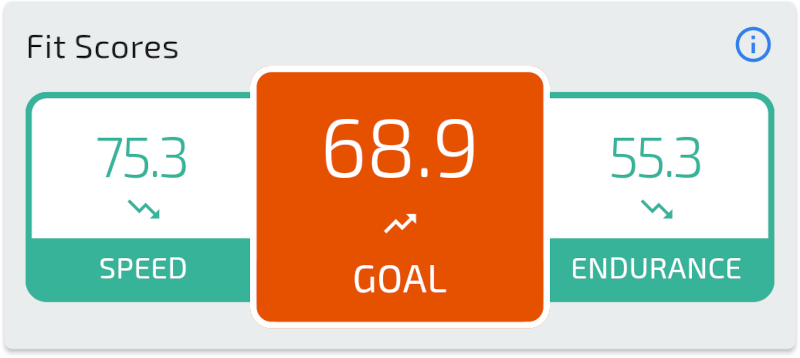
As the above image illustrates, the TrainAsONE mobile app displays each of your current Fit Scores on the Home screen, along with a graphic below to indicate their current trend. An interesting point in the above example is that it is possible for your Speed and Endurance Scores to be trending down, yet your Goal Score be trending up. Furthermore, depending on certain factors, including the stage of your training, your Goal Score may trend downwards. Look out for some specific FAQs and articles to help answer when and why this may occur.
Additionally, whilst all the scores are in the range from 0 to 100, the spread varies. In other words the average score for Speed across the population is quite different for Endurance. This is a potential area of work for the future.
In due course we will elaborate a little on how the scores are derived. However, a very important point to raise now is that the underlying techniques being used can also be turned to race time prediction. We’ve already done this, with great success – our own comparison with other published work demonstrates superior accuracy. This, and other factors, give us great confidence and excitement about our Fit Scores. We still feel that we’ve only scratched the surface, and have many avenues to research that will make them and other features in mind even greater and provide an unrivalled training experience.
Further Reading
One of the 3 Fit Scores to assess and monitor your running performance. As with the 2 other scores, your Goal Score is provided as a number between 0 and 100, with 100 being world record performing.
Directly targeting your current goal, this metric may be of more interest than your Speed or Endurance Score. The relevant goal will change according to your goals within TrainAsONE. Commonly it will be your next primary race, otherwise your preferred distance goal.
For clarification, whilst your Goal Score is between 0 and 100, this is not a percentage and does not indicate a probability of completing your goal (race) in your target time. Features related to this are on the roadmap.
Race time prediction involves estimating the time it will take to complete a particular race distance based on various factors such as previous performances, training data, and individual characteristics. While race time prediction models can provide useful insights, it’s important to remember that they are only estimates and individual performance can still vary significantly.
There are several methods and models used for race time prediction, ranging from simple calculations to complex algorithms. Here are some commonly used traditional approaches:
Personal Experience: One of the simplest methods is to rely on your personal experience from previous races. If you have run a similar distance in the past, you can estimate your race time based on your performance in that race. However, this method assumes that your fitness level and training conditions have remained relatively constant.
Rule of Thumb: The rule of thumb method uses a general formula to estimate race times. For example, one commonly used formula is the “doubling time” rule, which states that if you double the distance of a race, you should expect your time to be roughly 2.1 times longer. While this method can provide a rough estimate, it may not account for individual variations in fitness and training.
Race Time Calculators: Online race time calculators are popular tools that use algorithms to predict race times. These calculators typically ask for input such as your recent race times, distance, and terrain. They use statistical models and algorithms to generate a predicted race time based on the input data. It’s important to note that these calculators are based on averages and may not capture individual characteristics accurately. The most popular example is Riegel’s Formula.
Regression Models: More advanced race time prediction models use regression analysis to estimate race times based on multiple variables. These models take into account factors such as age, gender, training volume, recent performances, and environmental conditions. They use historical data to create a mathematical equation that predicts race times based on these variables.
TrainAsONE
Utilising cutting-edge Artificial Intelligence and Machine Learning technologies TrainAsONE has created a unique race time prediction methodology. Through extensive testing and analysis, these innovative algorithms have proven to outperform existing published approaches in terms of accuracy. Users can now access these enhanced predictions as part of the Artemis algorithm update.
Riegel’s formula is a mathematical equation used to predict race times for runners. It was first published by Pete Riegel, an American research engineer in 1977.
The formula takes into account a runner’s recent race time and distance to then estimate the time to complete an upcoming race:
T2 = T1 x (D2 / D1) ^ 1.06
Where:
- D1 = Previous race distance
- D2 = Upcoming race distance
- T1 = Previous race time
- T2 = Prediction of race time for upcoming race
Overall, the evidence suggests that Riegel’s formula is a useful tool for predicting race times in runners, but it should not be relied upon as the sole means of determining race performance. Other factors such as recent training history and specificity should also be taken into account when predicting race times.
Despite its limitations, Riegel’s formula continues to be widely used by runners, coaches, and exercise physiologists to help predict race times and track performance improvements.
One of the 3 Fit Scores to assess and monitor your performance with regards to your top-speed running.
When training for races of less than around 3 km, this metric will have more relevance than your Endurance Score and resembles or at least trends similar to your Goal Score.
TRaining IMPulse (TRIMP) is a method for quantifying training load based on the duration of an exercise and a metric such as speed, heart rate, or perceived effort. It draws its roots from the work of Eric Banister in 1975 on swimmers, but it was not until the 1990s that application in other sports and simplifications on its use made it more popular.
Further Reading:
Training monotony refers to a state or condition in which an athlete’s training has become repetitive and lacking in variation of intensity, volume, or type of exercise. A clear example of high training monotony would be running the same route, every day, at the same pace.
In sports science, Training Monotony is a single number calculated from an analysis of workouts, to determine the statistical variation in day to day training. Research would suggest that monotony figures below 1.5 are desirable, with figures above 2.0 as potentially being a cause for concern.
Training monotony is most often considered in conjunction with Training Strain.
A single metric that attempts to represent both the volume and variation in your day-to-day activities.
Whilst Training Monotony helps to understand the periodisation of training and assess recovery, the volume of training (load of training over time) also needs to be considered. Too low and training will be ineffective. Too high and you’ll be moving into the realms of overtraining. Training Strain is one metric to aid with this, combining changes in load and monotony over time into one metric. The level of strain a particular athlete should be experiencing at any moment is dependent on many factors, but it can be safely said that rapid increases are bad. This would most commonly signify a rapid increase in load without adequate recovery.
Training Stress Balance (TSB) is a concept used in athlete performance monitoring to assess an athlete’s readiness for competition. It provides a measure of the accumulated training load and its impact on an athlete’s readiness and fatigue (often poorly termed fitness & freshness). TSB is often used in endurance sports such as running, cycling, and swimming.
TSB is based on the principle of acute and chronic training load. Acute training load refers to the short-term or immediate training stress placed on an athlete, typically measured over a period of one week. Chronic training load, on the other hand, represents the long-term or accumulated training stress over a longer period, often several weeks or months.
Eric Bannister et al, devised TSB in the early 1990s. It is a simplification of previous works (including his own), and importantly does not help to predict performance, only relative performance. It is very commonly stated that TSB was created by Andrew Coggan, however, this is incorrect. The missunderstanding appears to have arisen as Coggan devised the Training Stress Score (TSS) used within the TrainingPeaks software to estimate the stress of a single cycling workout, which is then applied to the TSB formula.
To calculate TSB, the acute training load is subtracted from the chronic training load. The formula is as follows:
TSB = Chronic Training Load – Acute Training Load
The chronic training load provides an estimate of an athlete’s overall fitness level and is a reflection of their training history. It takes into account the duration, intensity, and frequency of training sessions over an extended period. The acute training load, on the other hand, represents the recent training stress that an athlete has experienced, usually measured over the past week.
By subtracting the acute training load from the chronic training load, TSB provides an indication of an athlete’s fatigue or freshness. A positive TSB indicates a state of freshness, suggesting that an athlete is well-rested and has recovered from previous training. A negative TSB, on the other hand, indicates accumulated fatigue, suggesting that an athlete may be at a higher risk of injury or experiencing decreased performance.
To support their use, it is commonly stated with conviction that TSB and its allied models have been verified and validated. This should be taken with some caution. For example, a literature search only demonstrates 1 study in this area looking specifically at runners. And the model validation in this study was performed on 2 subjects. The subjects being the authors of the study itself.
Further Reading:
vVO2max (velocity at VO2max) refers to the running speed at which an individual reaches their maximum rate of oxygen consumption. It is often considered a significant measure of cardiovascular fitness and endurance.
vVO2max is measured in the laboratory during a graded exercise test, where the intensity of running gradually increases, and the individual’s oxygen consumption is measured at different stages. The point at which oxygen consumption plateaus despite further increases in exercise intensity is considered their VO2max. The corresponding running speed at this point is referred to as their vVO2max.
Commonly running at vVO2max can only be maintained for about six minutes, though considerable variation exists. The vVO2max of world class middle and long-distance runners may exceed 24 km/h (14.9 mph or about 4:00/mile pace), making this speed slightly comparable to 3000 m race pace. For many athletes, vVO2max may be slightly slower than 1500 m or mile race pace.
Training at or near vVO2max is a common strategy to improve aerobic capacity and overall running performance. By incorporating workouts that involve running at or slightly above vVO2max, athletes can enhance their cardiovascular system, improve oxygen delivery to working muscles, and increase their lactate threshold. These training sessions typically involve short, intense intervals with brief recovery periods.